Surveys: Faculty Use Cases

- Sections
CNDLS and OADS
As a researcher, assessment professional, and data scientist, Liza Moore uses Qualtrics as her go-to survey tool for any survey project at Georgetown. It provides powerful functionality needed for any complicated surveys with skip logic, allows her to embed additional data fields to my contact lists, and includes automated reporting tools that summarize data from my surveys. It’s great that Georgetown faculty and staff can access this tool for free, along with full help desk services as well.
Her favorite Qualtrics feature is the “Results” reporting – once you have collected some data in your survey, Qualtrics automatically sets up tables and charts with results from each question. This feature saves so much time when you need to share quick, high-level results with stakeholders who just want to know the bottom line. These quick reporting features within Qualtrics helps her juggle multiple projects and competing priorities.
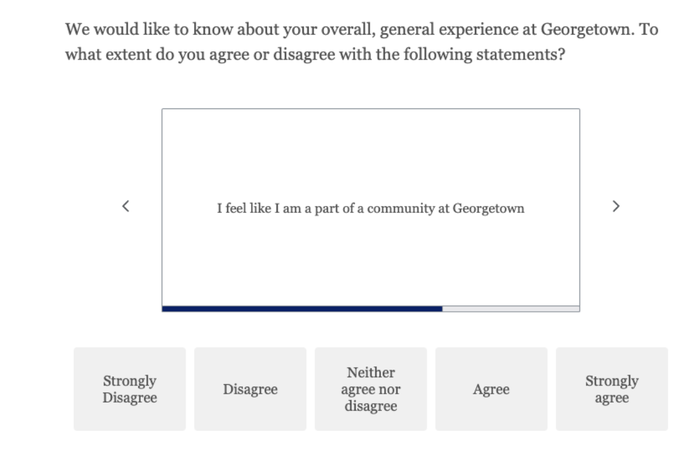
Qualtrics offers a wide variety of design options and question set-ups. In particular, she uses the ‘carousel’ feature when asking survey questions on a rating scale. She recently used this feature when surveying Georgetown students about their experiences. This format allowed students to engage more interactively with the question, flipping through each item in the carousel and hitting a button to respond, rather than reading through a matrix of bubbles or repetitive question text. (The response rate was higher than when a different question format was used!)
It may take a bit to get familiar with all of the Qualtrics options and use cases, but it’s worth it to design the best surveys. Here's an image of the carousel feature: